
This guide is the support article for the SEO Cost Calculator. Use it to define the inputs before you estimate your monthly SEO budget. For the full SEO topic path, start from the SEO Cost Hub.
Article scope
Primary keyword: monthly SEO budget
Secondary keywords: SEO budget calculator, SEO budget planning, SEO tools cost, SEO agency cost, technical SEO budget, SEO content budget.
Search intent: the reader wants to estimate how much to spend on SEO and what categories should be included.
Target calculator: SEO Cost Calculator. Target cluster: SEO Cost Hub.
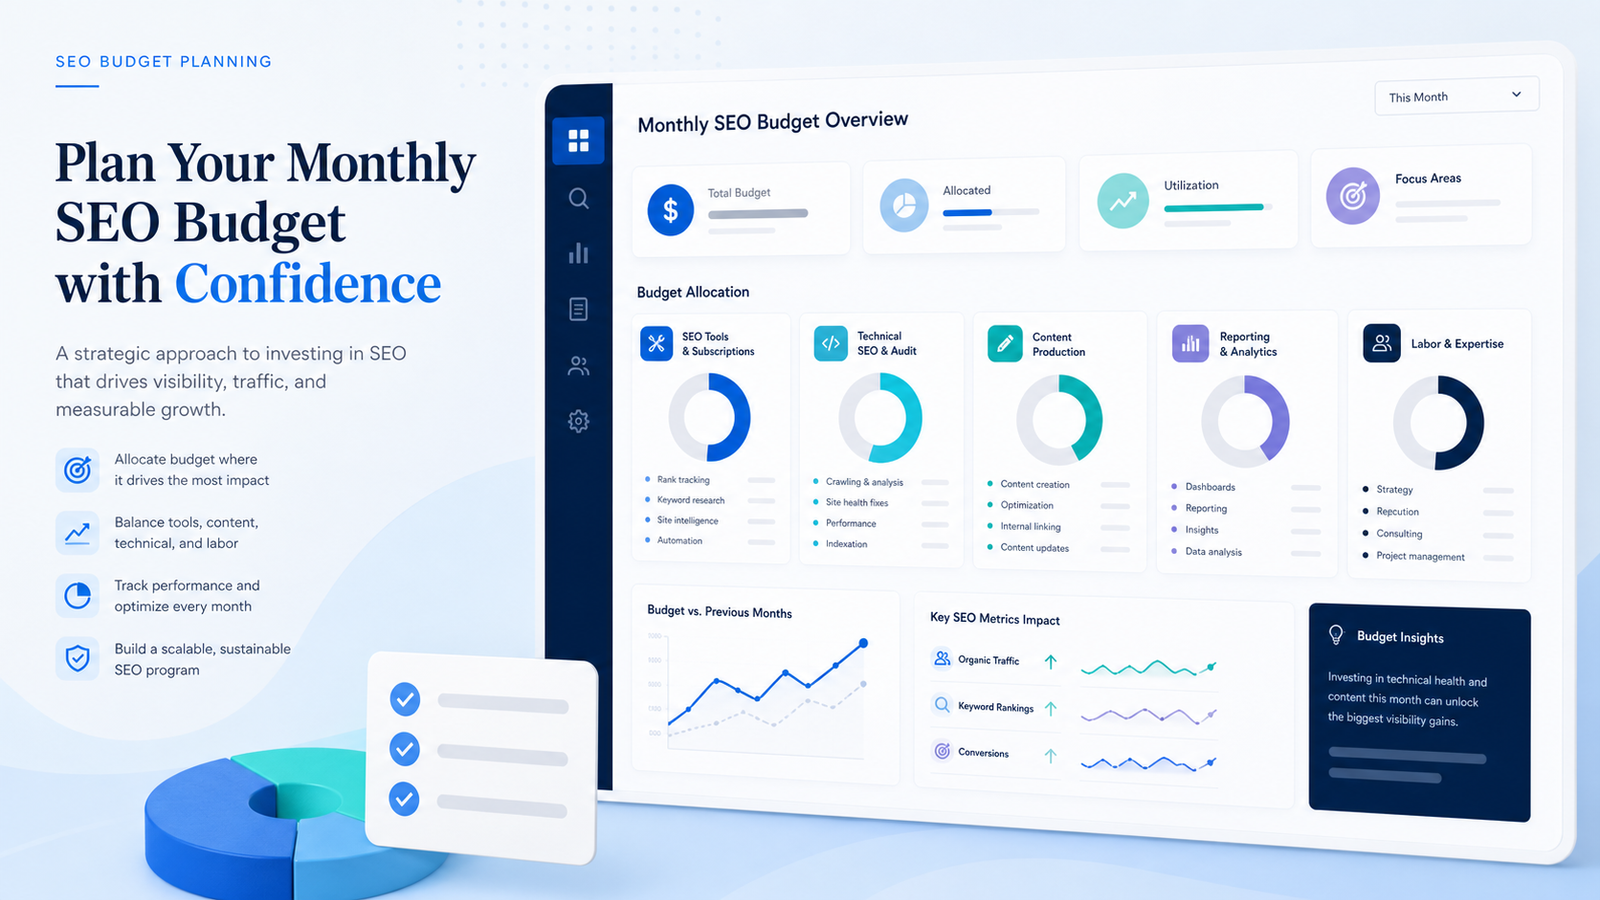
Why monthly SEO budget planning needs separate buckets
SEO cost is often misunderstood because buyers ask for one number: “How much should SEO cost per month?” That question is too broad. A small local website, a SaaS startup, an ecommerce catalog, and an agency managing client projects do not need the same SEO budget. They differ in technical complexity, content volume, reporting needs, keyword tracking, implementation workload, and competitive pressure.
A useful monthly SEO budget separates software from work. Software gives you crawling, keyword data, rank tracking, backlink analysis, reporting, dashboards, and audit workflows. Work turns that information into technical fixes, content updates, new pages, internal links, measurement, and prioritization. If you only budget for tools, you may have data but no execution. If you only budget for labor, you may lack the diagnostic systems needed to choose the right work.
Google’s own documentation reinforces this split. The Google SEO Starter Guide focuses on crawlability, useful content, links, page experience, and site structure. Those are not one-time line items. They require recurring monitoring, implementation, and review.
The five buckets of a realistic monthly SEO budget
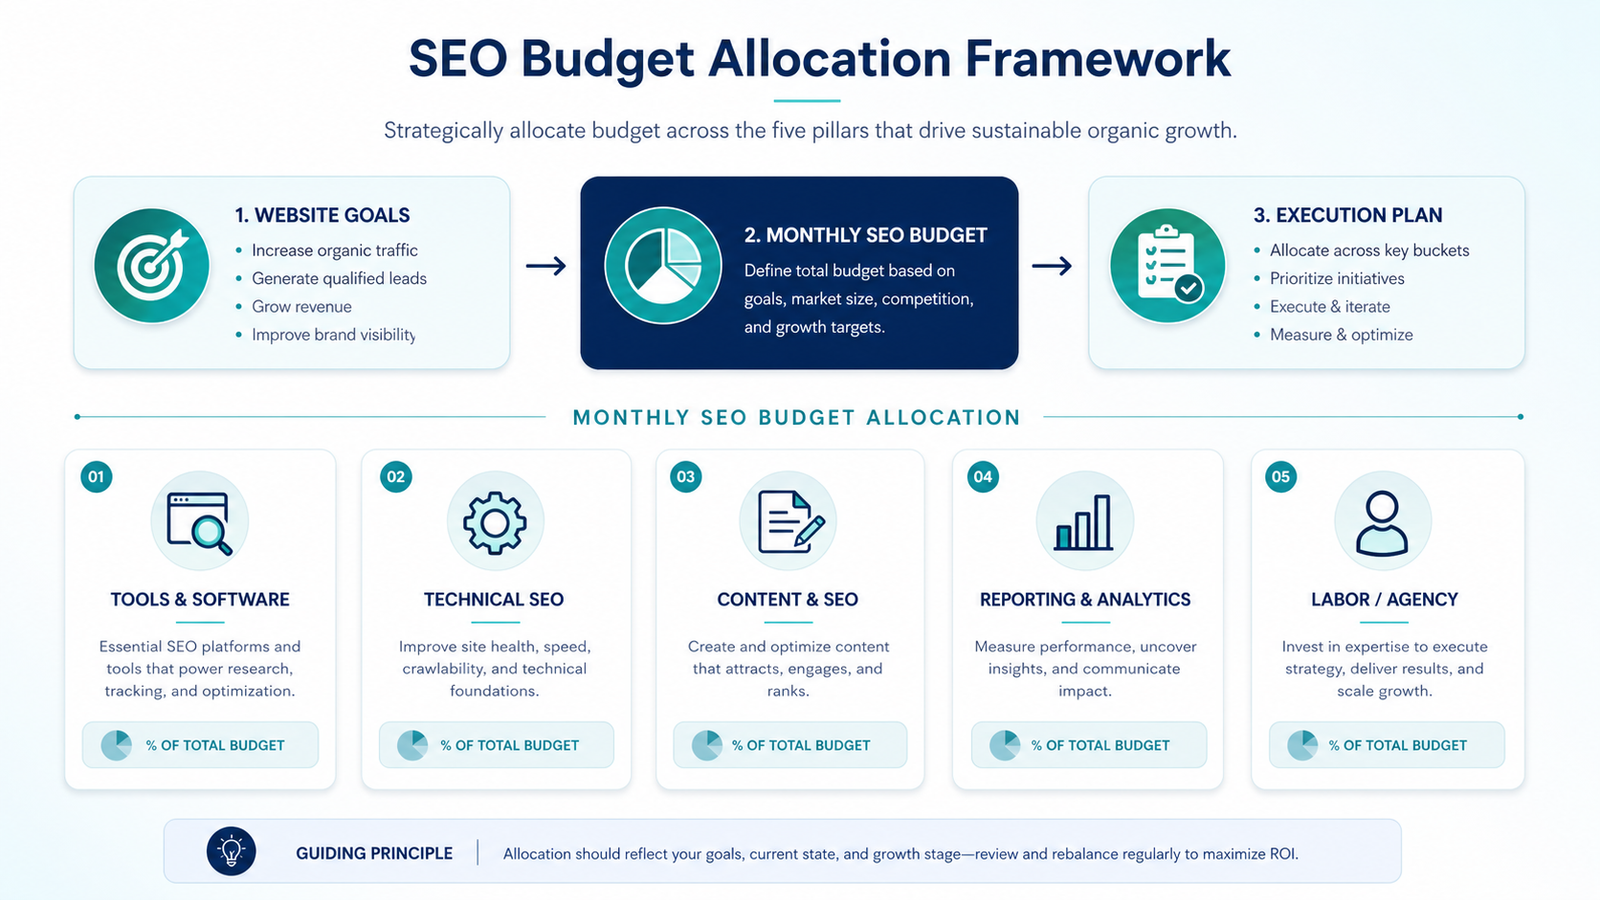
1. Tools and software
Include keyword research, rank tracking, crawling, backlink analysis, reporting dashboards, log analysis, content optimization, and project management. Review official pricing from tools such as Ahrefs and Semrush before assuming a starter plan is enough.
2. Technical SEO
Technical SEO includes crawlability, indexation, site architecture, redirects, canonical tags, structured data, page speed, internal linking, and template cleanup. A site with technical debt needs more budget here than a clean site with a small footprint.
3. Content production
Content budget covers briefs, writing, editing, expert review, images, updates, comparison tables, FAQs, and publishing. For TrueSaaSCost, content must serve a calculator, hub, guide, comparison, FAQ, or brand page.
4. Reporting and analytics
Reporting includes GSC, GA4, rank tracking, dashboard setup, conversion events, and monthly analysis. Without reporting, it is difficult to tell whether content is being indexed, clicked, and used.
5. Labor or agency delivery
Labor is often the largest budget item. It includes strategy, technical implementation, writing, editing, design, publishing, outreach, QA, and project management.
6. Reserve for fixes
Leave budget for unexpected work: indexing issues, site migrations, template problems, tracking failures, or content refreshes. SEO programs rarely follow the exact plan every month.
SEO budget planning table
| Budget area | What it includes | When it needs more budget | Calculator input |
|---|---|---|---|
| SEO tools | Rank tracking, keyword research, crawlers, audits, backlink data, dashboards. | More projects, tracked keywords, competitors, seats, exports, and reporting needs. | Tools and software |
| Technical SEO | Crawl fixes, speed, structured data, internal links, redirects, indexation, templates. | Large sites, old CMS setups, migrations, duplicate pages, weak Core Web Vitals. | Technical audit and fixes |
| Content | New articles, updates, briefs, editing, visuals, tables, FAQ, expert review. | Competitive keywords, weak topical coverage, thin pages, low CTR or outdated content. | Content production |
| Reporting | GSC, GA4, dashboards, rank reports, event tracking, monthly analysis. | Multiple stakeholders, client reporting, conversion tracking, revenue attribution. | Reporting and analytics |
| Labor | SEO strategy, implementation, writing, editing, design, publishing, QA. | When internal team lacks time or technical SEO skills. | Freelancer, consultant, or agency |
How to size your monthly SEO budget by situation
There is no universal SEO budget, but there are recurring patterns. A new small site usually needs technical cleanup, analytics, core pages, and a small number of focused support articles. A SaaS site with calculators needs stronger information architecture, schema, content clusters, and internal linking. An ecommerce site may need category templates, faceted navigation cleanup, product content, and technical monitoring. An agency may need more seats, exports, project limits, and reporting workflows.
Early-stage site
Prioritize technical foundation, GSC/GA4 tracking, indexability, one hub, one calculator, and a small number of high-intent supporting pages. Do not overspend on tools before execution is consistent.
Growing content cluster
Increase budget for content production, refreshes, internal links, screenshots, comparison tables, and schema. This is where TrueSaaSCost currently sits for Email and SEO clusters.
Competitive SaaS category
Budget more for expert content, technical implementation, comparison pages, brand pages, content updates, and reporting. Thin AI content will not be enough.
Agency or multi-site work
Budget for tool seats, client reporting, project limits, dashboards, QA, and repeatable workflows. Software cost can rise quickly when every client needs tracked keywords and reports.
What not to forget
Core Web Vitals and page experience can create recurring technical work, especially if templates, scripts, ads, or media assets change. Google’s Core Web Vitals documentation is useful for understanding why performance work belongs in an SEO budget rather than being treated as a one-time design issue.
Internal links also need budget. For a calculator-led site, the goal is not to publish random posts. The goal is to connect the homepage, calculator, hub, guides, FAQ pages, comparison pages, and brand pages so users and crawlers can understand the topic structure. That is why this guide links back to the SEO Cost Hub, the SEO Cost Calculator, the Low-Price SEO Hidden Costs guide, and the SEO Software Cost for Agencies comparison.
SEO budget checklist
- Define your target pages: calculator, hub, guide, comparison, FAQ, or brand page.
- Estimate how many pages need technical fixes or content refreshes.
- List tools needed for crawl, keyword tracking, reporting, and competitive research.
- Separate writing cost from editing, images, tables, and publishing work.
- Budget for reporting, not just execution.
- Leave room for technical surprises, indexing issues, and content updates.
- Run the calculator before committing to monthly retainers or annual tools.
Estimate your monthly SEO budget
Use the calculator to combine tools, technical work, content, reporting, and labor into one realistic monthly budget.
FAQ
What should a monthly SEO budget include?
A monthly SEO budget should include tools, technical SEO, content production, reporting, and execution labor. For larger sites, it should also include a reserve for migrations, indexing problems, or unexpected technical fixes.
Is SEO software enough without labor?
No. SEO software helps with data, auditing, tracking, and reporting. It does not implement technical fixes, write useful content, improve internal links, or update pages. Labor is usually required to turn software output into results.
When should I budget more for technical SEO?
Budget more for technical SEO when the site has crawl issues, poor Core Web Vitals, duplicate pages, weak internal links, migration risk, complex templates, or indexation problems.
How do I estimate SEO content budget?
Estimate the number of new or updated pages, then include research, briefs, writing, editing, visuals, tables, FAQ, schema, publishing, and internal linking. Do not count only writing cost.
What is the next step after planning the budget?
Use the SEO Cost Calculator to model your tools, labor, technical work, content, and reporting assumptions. Then use the SEO Cost Hub to choose the next supporting guide.
SEO execution model
Agency, freelancer, or in-house SEO?
Compare execution models before estimating your monthly SEO budget.
Read the SEO execution comparison